Photo by Tim Schmidbauer on Unsplash
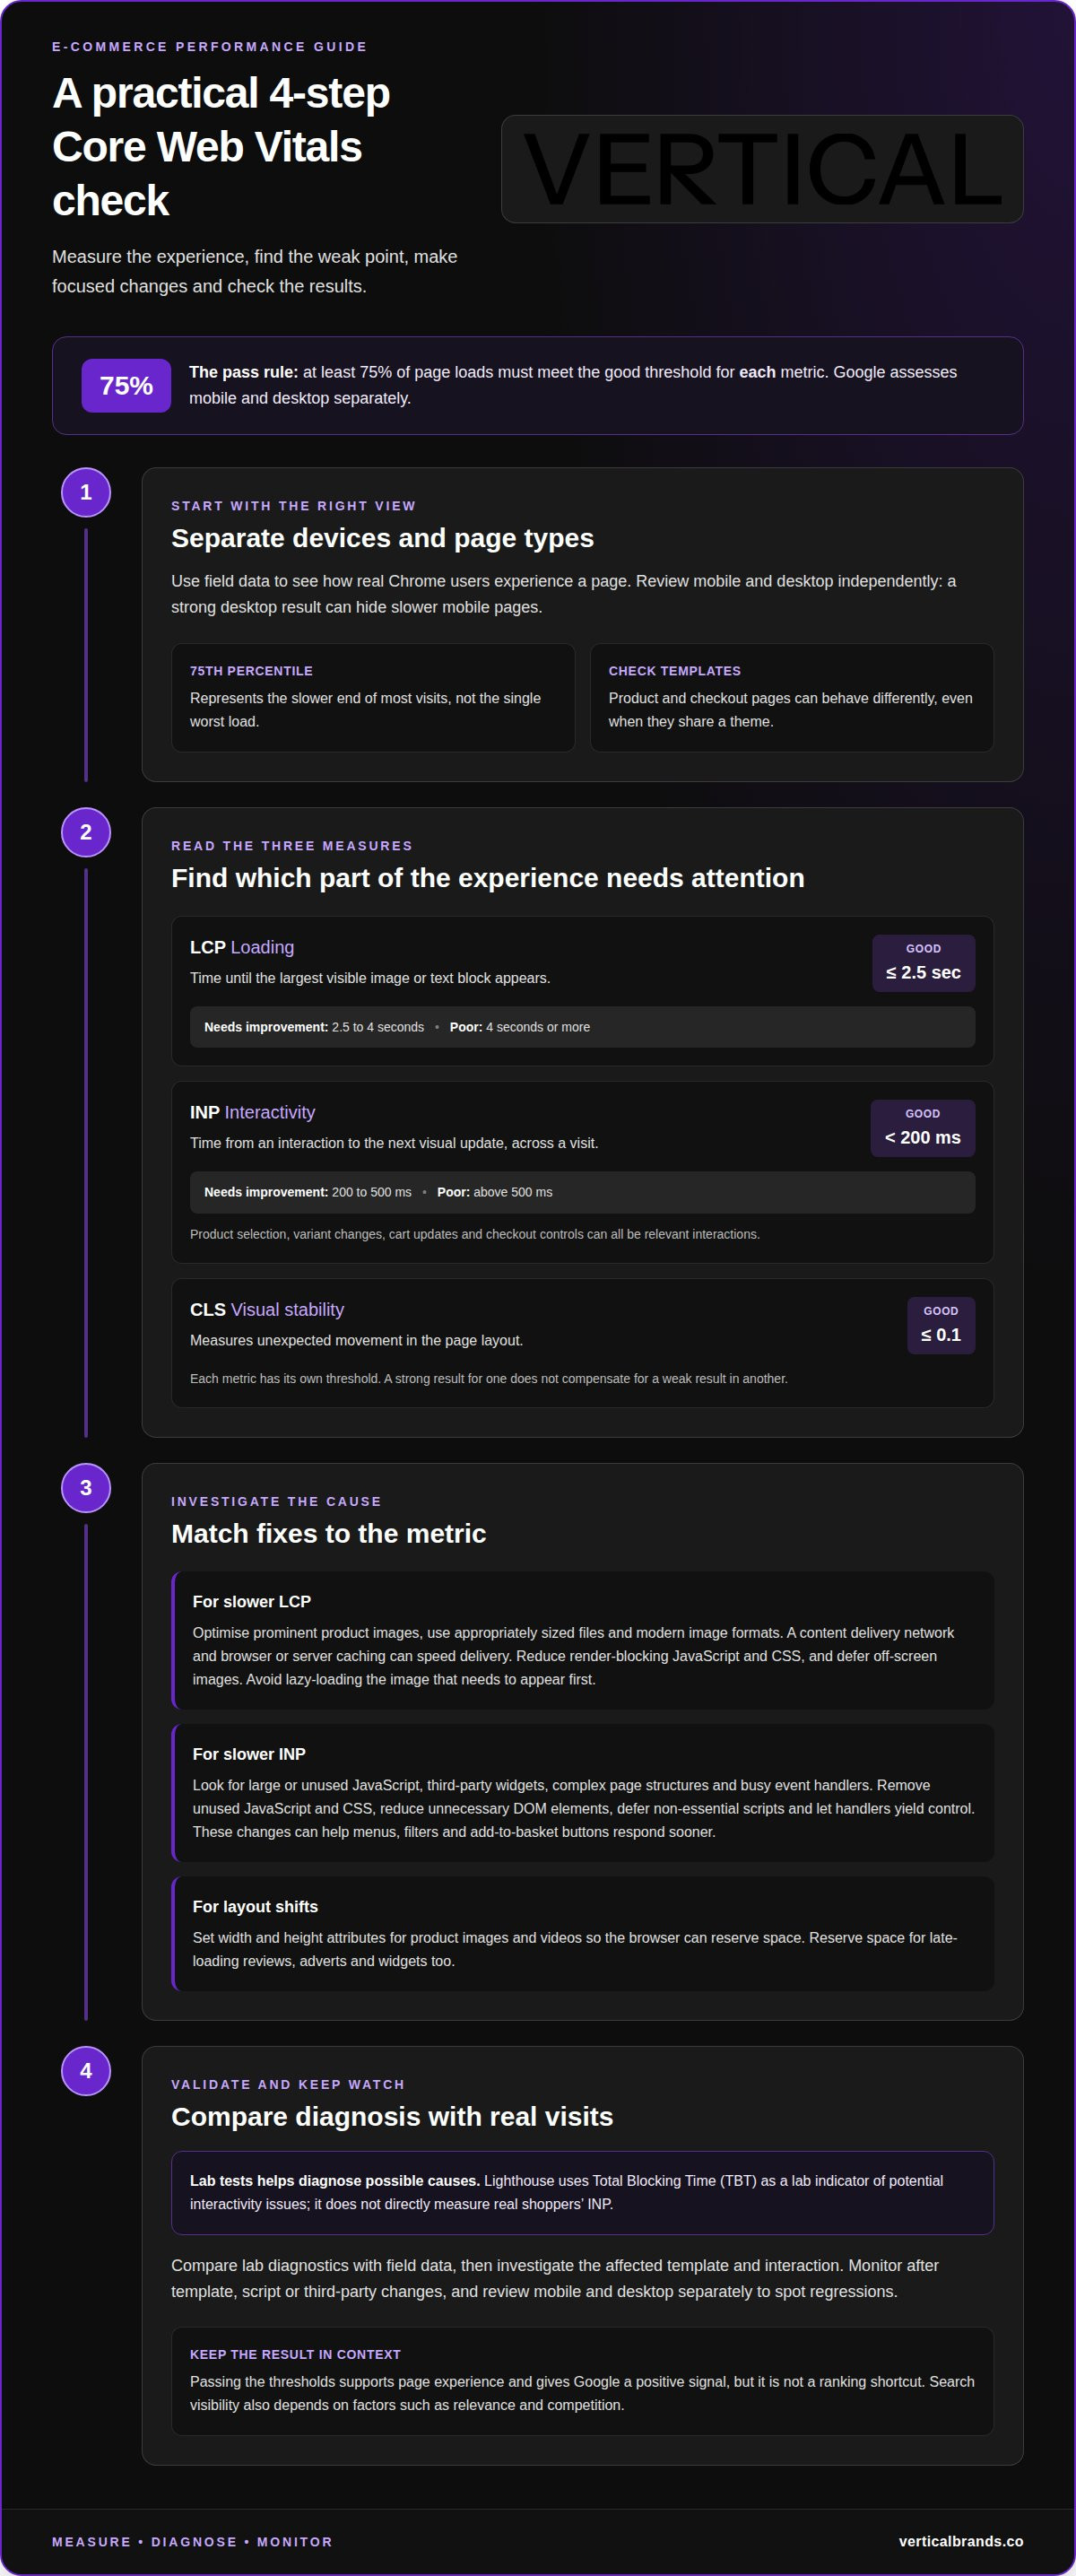
There’s no single average Core Web Vital score for an e-commerce store. Core Web Vitals for e-commerce sites meet Google’s benchmark when at least 75% of page loads pass each metric: LCP is 2.5 seconds or less, INP is below 200 milliseconds, and CLS is 0.1 or less. The results are assessed separately on mobile and desktop, so a strong desktop score can mask a slower mobile experience.
Fast loading matters, but shoppers also need product pages to respond promptly and remain visually stable as they browse. That’s why INP measures interactions throughout a visit, not just the first one. This article explains how the scores are measured, what INP means for Google rankings and how ongoing monitoring can reveal problems across key store pages. It also covers what the thresholds tell you, how lab tests differ from real-user data and why scores can shift after a site change. A useful performance view is more than a single number: it shows how the store behaves for people across devices and over time.
Key Takeaways
- INP measures responsiveness throughout a visit. Reducing unused JavaScript and limiting third-party code can help keep interactions responsive.
- Separate mobile and desktop performance views; a strong result on one device don’t rule out problems on the other.
- Use real-user data to understand field performance. Lab tests can help diagnose issues, with Total Blocking Time serving as a proxy for potential interactivity problems.
- Monitor performance over time and after site changes. Template, script and third-party updates can introduce regressions, so regular monitoring help surface them.
- Passing the Core Web Vitals thresholds isn’t an instant ranking guarantee. Faster, more stable pages can still support a smoother shopping experience and better search visibility.
Is Interaction to Next Paint (INP) a confirmed Google ranking factor?
Yes. INP is a confirmed Core Web Vital and contributes to Google’s page experience signals, but it cannot guarantee higher rankings by itself. Google replaced First Input Delay (FID) with INP on 12 March 2024. Unlike FID, INP assesses responsiveness across a visit, including product selection, variant changes, cart updates and checkout controls.
INP measures the time between a user interaction and the next visual update. Google assesses the 75th percentile, so the score reflects the experience of most visits rather than one unusually slow click. Below 200 milliseconds is good; 200 to 500 milliseconds needs improvement; above 500 milliseconds is poor. A slow filter response can therefore matter even if the first tap feels immediate.
Largest Contentful Paint (LCP) tracks how quickly the largest visible image or text block appears during page load. Aim for 2.5 seconds or less. A result from 2.5 to 4 seconds needs improvement, while 4 seconds or more is poor. On a product page, a large hero image can become the LCP element, making its size and delivery speed important.
To improve LCP, optimise prominent product images, serve appropriately sized files and use modern image formats. A content delivery network and browser or server caching can speed up delivery. Reduce render-blocking JavaScript and CSS, and defer off-screen images. Avoid lazy-loading the image that needs to appear first, since delaying the largest element can worsen its score.
Cumulative Layout Shift (CLS) measures unexpected movement in the page layout. Keep CLS at 0.1 or less for a good result. Product images and videos should include width and height attributes, so the browser reserves space before they load. Reserve space for late-loading reviews, adverts and widgets too. Otherwise, a shopper may tap a size selector just as content shifts beneath it.
INP problems often start when JavaScript keeps the main thread busy. Large scripts, unused code, complex page structures and third-party widgets can delay event handlers. Remove unused JavaScript and CSS, reduce unnecessary DOM elements and defer non-essential scripts. On e-commerce pages, this can help menus, filters and add-to-basket buttons respond sooner. Some event handlers also need to yield control instead of monopolising the thread.
Lab tests help diagnose causes, but they don’t directly measure real shoppers’ INP. Lighthouse uses Total Blocking Time (TBT) as a lab indicator of potential interactivity issues. Compare that diagnostic with real-user data, then investigate the affected template and interaction. A product page and a checkout page can behave differently, even when they share a theme.
Passing all three thresholds supports a better page experience and gives Google a positive signal, but it is not a ranking shortcut. Search visibility still depends on other factors, including relevance and competition. Treat INP, LCP and CLS as operational measures: identify the slow interaction or layout shift, address its cause, then monitor the result across mobile and desktop visits.
What’s the Average Core Web Vital Score for E-Commerce Stores?
There is no single average score that defines a healthy online shop. Google’s benchmark assesses three metrics at the 75th percentile, separately for mobile and desktop page loads.
Passing benchmarks and field data
A passing benchmark means at least 75% of visits meet the good threshold for each Core Web Vital. Field data reflects how real Chrome users experience a page, rather than how it performs under controlled test conditions. This distinction matters because a fast desktop test can conceal slower mobile pages, or problems on a particular product template.
Google uses the 75th percentile, so the result represents the slower end of most visits, not the worst single load. Field data can help indicate whether a page or similar pages are meeting performance benchmarks. Use lab results to investigate possible causes, then compare them with field data to understand the experience shoppers actually receive.
Changing definitions and thresholds
Core Web Vitals definitions can evolve as Google assesses how well the metrics represent user experience. A pending metric remains in that phase for at least six months, while a stable metric is not expected to change more than once per year. This gives store teams time to follow updates without treating every change as an immediate technical requirement.
For e-commerce teams, the practical considerations are a metric’s current status and published threshold. Tie implementation decisions to the stable metrics in use, while monitoring announcements for changes. A new definition may alter how a page is assessed, even if its design and code have not changed.
The three current metrics cover loading, interactivity and visual stability. Largest Contentful Paint (LCP) measures when the largest visible content appears: good is 2.5 seconds or less, 2.5 to 4 seconds needs improvement, and 4 seconds or more is poor. Interaction to Next Paint (INP) measures responsiveness across interactions: below 200 milliseconds is good, 200 to 500 needs improvement, and above 500 is poor. Cumulative Layout Shift (CLS) measures unexpected movement; 0.1 or less is good.
Each metric has a separate threshold, so a strong LCP cannot compensate for poor INP or CLS. The page passes the Core Web Vitals assessment when at least 75% of page loads meet the good threshold for all three metrics. For example, product pages might pass on desktop but fail on mobile, where slower devices and network conditions affect loading and interaction.
These thresholds do not set a single average for all e-commerce sites. Platform, page template, device mix, scripts and image weight all influence field results. A category page with filters may show different INP from a simple product page. Read PageSpeed Insights by URL group and device, then prioritise templates with the clearest gap against a threshold. This turns an overall pass or fail into a practical view of where performance work matters.
Ongoing performance monitoring
A single test cannot show how every store page performs for real shoppers. Ongoing monitoring tracks changes across templates, devices and releases, helping teams identify regressions before they persist.
Monitoring performance across page types
Monitoring Core Web Vitals for e-commerce sites means tracking performance across recurring page templates, including home, product, category, blog and checkout pages. Each type loads different content and supports different interactions, so one score cannot represent the whole store.
A homepage may depend on a large campaign image, while a category page may rely on filters and product cards. Product pages add galleries, reviews and variant selectors; checkout pages depend on forms and payment scripts. Blog pages can introduce embedded media or additional fonts. Track these templates separately so a healthy homepage result doesn’t conceal a slow checkout or unstable product layout.
Review representative URLs after theme, app, content or checkout changes. Compare mobile and desktop results, then group recurring problems by template. If several product pages show the same loading delay, investigate shared images, scripts or components before treating each URL as an isolated fault. This connects a change to the affected page type instead of obscuring it in a store-wide average.
Measuring field performance
Field performance uses real-user data to show how pages behave outside controlled tests. Google Search Console groups URLs with similar issues, while CrUX, the Chrome User Experience Report, collects anonymised measurements from Chrome users.
The Search Console Core Web Vitals report shows LCP results based on page-loading performance across 75% of URL visits. That view helps identify URL groups requiring attention, rather than relying on a single test. CrUX adds real-world context across devices and visiting conditions. Neither report explains every technical cause, so pair field data with diagnostic tests of affected templates.
After a fix, Google may use usage data for up to 28 days when validating whether an issue has been resolved. Keep monitoring during that period. A temporary improvement in one test may not yet reflect performance across real visits.
Performance baselines and CMS types
A useful baseline records each template’s field performance against the good Core Web Vitals thresholds, split by mobile and desktop. Use Core Web Vitals for e-commerce sites as a shared baseline for comparing releases, redesigns and integrations.
Record representative results for home, product, category, blog and checkout pages, alongside recurring LCP, INP and CLS issues. Compare later reports against the same templates. For example, a newly added review widget may affect product-page loading or visual stability without changing the homepage. This gives teams a clearer signal than comparing unrelated URLs.
Proprietary and open-source CMS platforms have no automatic performance advantage based on that label alone. Results depend on implementation, server response, themes, extensions, scripts and image delivery. A lean configuration can perform well on either type; poorly managed add-ons can create friction on either. Assess live pages and field data, not the CMS category in isolation.
Will passing Core Web Vitals instantly boost my organic search rankings?
No. Passing Core Web Vitals does not trigger an instant ranking increase. Google uses page experience as one factor among many, so relevance, content quality and competition still shape organic results. A shop may improve its scores without seeing an immediate change in position. Treat the metrics as performance signals, not a shortcut around search strategy.
The business case starts with the user experience. A page that loads promptly, responds to interactions and avoids unexpected shifts removes friction from product discovery. A shopper choosing a size or opening a basket needs controls that respond clearly. If product images jump during loading, the shopper may tap the wrong element. These details shape whether browsing feels dependable.
Speed can also affect engagement. One cited market figure says 53% of users leave a website that takes more than three seconds to load. That figure is not a prediction for every shop, but it highlights the cost of delay. A slow category page can interrupt product exploration; a lagging checkout can obstruct the final purchase step. Performance work should target the pages where friction affects the journey.
Field measurement and lab testing answer different questions. The Chrome User Experience Report (CrUX) collects anonymised real-user measurements for Core Web Vitals. Google Search Console groups field issues across URLs, helping teams spot patterns beyond a single test. Lighthouse, by contrast, runs a controlled lab audit. It does not measure INP directly; it uses Total Blocking Time (TBT) to help diagnose potential interactivity problems.
Use both views. If Lighthouse shows high TBT on a product page, inspect JavaScript tasks that block the main thread. Then compare the diagnosis with field data to see whether real shoppers experience poor responsiveness. Lab conditions can differ from mobile devices, networks and browsing behaviour, so a clean test alone cannot represent every visit. Field data also takes time to reflect sustained changes.
Better performance can support revenue by reducing barriers, but it does not prove that a score change caused a sales increase. Deloitte’s study reports that a 0.1-second faster load time paired with FID and CLS optimisations can increase conversions by 8.4%. That finding is a specific study result, not a guaranteed outcome for every retailer. Product range, pricing, demand and checkout design also shape conversion.
Measure performance alongside commercial outcomes. Compare mobile conversion, basket progression and engagement for affected page templates before and after changes. A score may improve while sales remain steady, or conversion may rise for other reasons. Read rankings, user experience and revenue as connected measures, not interchangeable results. Consistent monitoring helps distinguish a technical improvement from a wider change in shopper behaviour.
How Core Web Vitals affect conversions and search visibility
Core Web Vitals can improve the conditions that support a purchase, but they don’t determine conversion rates alone. Faster loading helps shoppers reach products sooner; responsive controls make filtering and selecting options easier. Stable layouts reduce mis-taps when product details or basket buttons move during loading. These improvements remove friction from the buying journey, rather than guaranteeing a sale.
A 0.1-second faster e-commerce page can result in up to 8.6% more pages viewed per session. More browsing may mean shoppers discover additional products, but it doesn’t automatically increase average order value. Product relevance, price, stock availability and delivery options also affect what customers buy. A faster product page supports discovery; merchandising and the offer shape the basket.
Conversion analysis should separate the technical change from other commercial activity. Compare affected page templates before and after optimisation, using the same device groups and comparable periods. Track product views, add-to-basket actions, checkout progression and completed orders. If loading improves but checkout completion remains unchanged, investigate form friction, payment options and unexpected charges separately.
Core Web Vitals also contribute to Google’s page experience signals, but passing them does not secure a ranking increase. Search visibility depends on relevance and other ranking factors. A technically sound page still needs useful product information that matches the shopper’s intent. For example, a fast page with vague sizing details may not satisfy a search for a specific fit or product specification.
Performance and search intent should work together. A category page needs clear product links and useful filters, while a product page needs accurate descriptions and visible purchase options. Strong responsiveness helps visitors use those elements; relevant content helps them decide. Speed improvements won’t replace well-structured pages, descriptive titles or content that answers shoppers’ questions.
Page experience can also affect abandonment. When a site meets the Core Web Vitals thresholds, users are 24% less likely to abandon a page load. Treat this as an observed relationship, not a guaranteed outcome for each store. Monitor abandonment alongside field performance, especially on mobile product and checkout pages, to see where delays or layout movement coincide with lost visits.
Average order value needs its own analysis. Compare basket values alongside conversion rate, product mix and promotional activity: a higher conversion rate can occur without a larger average basket. Segment results by landing page and device, then connect changes to the relevant user journey. This makes it easier to see whether improved performance supports product discovery, checkout completion or both.
To align technical performance with search visibility, strengthen your search engine optimisation strategy around relevant landing pages, useful content and measurable user journeys.
Vertical Brands
Vertical Brands helps e-commerce teams connect search visibility and customer acquisition with wider growth priorities. When Core Web Vitals findings sit alongside SEO work, the next step is to align technical priorities with the pages and journeys that matter to shoppers. Paid Search and Paid Social can support the wider acquisition strategy, while Email Marketing & CRM Management helps coordinate customer communications.
Turn to Vertical Brands when performance improvements need to fit into a broader digital growth plan, rather than remain isolated score changes. The focus is on connecting search, paid channels and customer relationships to clear commercial priorities. Each workstream addresses a different part of the customer journey, so the plan can reflect how they fit together.
Contact Vertical Brands to discuss how these priorities fit your e-commerce growth plans.
Turn performance insight into a growth decision
Make site performance part of a wider growth plan, not a standalone technical scorecard. Use Core Web Vitals for e-commerce sites as one input when deciding which customer journeys need attention. Then align website priorities with how shoppers discover products, consider a purchase and return. The value comes from connecting those decisions to clear commercial priorities.
Vertical Brands can support that wider plan through Klaviyo Email Marketing, Email Marketing & CRM Management and Paid Social. Each channel has a distinct role, but together they can connect acquisition activity with ongoing customer communication. Consider where performance improvements fit alongside those efforts and which customer journey deserves attention first.
Choose a practical priority, give it clear ownership and keep the wider growth plan aligned as the store evolves. Discuss your e-commerce growth priorities with Vertical Brands, and take the next step with a focused plan.
Frequently Asked Questions
How do I test INP locally in Chrome DevTools?
Use Chrome DevTools’ Performance panel to record a typical interaction and inspect its main-thread activity. Open a product page, start a recording, then change a variant or add an item to the basket. Look for long tasks around the interaction and identify scripts occupying the main thread. Local testing helps diagnose causes, but one browser session cannot represent the range of real-user experiences.
What Are The Most Important Google Web Vitals Ecommerce Owners Should Know?
Focus on Largest Contentful Paint (LCP), Interaction to Next Paint (INP) and Cumulative Layout Shift (CLS). They represent loading, responsiveness and visual stability, respectively. On a shop, these may relate to a product image appearing, a filter responding or a basket button moving during loading. Review them together: improving one metric doesn’t resolve a different problem elsewhere in the shopping journey.
What can you do to optimise for LCP?
Start by identifying the largest visible element, often a hero image or featured product photograph. Compress and correctly size the asset, serve it in a modern image format, and avoid delaying its request. Reduce render-blocking CSS and JavaScript, improve caching, and use a content delivery network where appropriate. Then retest the affected template, since category and product pages may load different assets.
What causes poor LCP?
Poor LCP often results from a slow server response, oversized images or resources that prevent the browser from displaying the main content. A product page may also delay its largest image behind scripts or stylesheets. Third-party tools can add work before the page becomes visible. Diagnose the specific URL and loading sequence first, rather than assuming every slow page has the same cause.
What are Core Web Vitals and their current thresholds?
Core Web Vitals are Google’s user-experience metrics for loading, interaction responsiveness and visual stability. The current good thresholds are LCP at 2.5 seconds or less, INP below 200 milliseconds, and CLS at 0.1 or less. These measures are assessed using real-user page loads. For an online shop, the same assessment can reveal different results across templates and devices.
How do Core Web Vitals affect e-commerce SEO and Google rankings?
Core Web Vitals contribute to Google’s page-experience signals, but passing the thresholds doesn’t guarantee a higher position. Rankings also reflect relevance and other search factors. A fast product page still needs accurate descriptions and content that matches the query. Treat technical improvements as support for search performance, alongside useful landing pages and a clear route from search result to product information.
What are good LCP, INP and CLS scores for online shops?
Good scores are LCP of 2.5 seconds or less, INP below 200 milliseconds, and CLS no higher than 0.1. Google assesses whether at least 75% of page loads meet each good threshold, separately for mobile and desktop. A shop therefore needs more than one favourable test: repeated field results across devices show whether performance is consistently within the target.
How do field data and lab data differ for Core Web Vitals?
Field data comes from real Chrome visits and reflects the devices, networks and interactions shoppers actually use. Lab data comes from a controlled test, which helps reproduce and investigate technical issues. Lighthouse doesn’t measure INP directly; it uses Total Blocking Time to indicate possible interactivity problems. Use lab results to locate causes, then compare them with field performance to assess real-world impact.